Micro-tomographe à rayons X à Biogéosciences

Micro-tomographe à rayons X à Biogéosciences

27 janvier 2014
Traitement de l'image sous logiciel AVISO

L’appareil de micro-tomographie à rayons X SkyScan 1174 détenu par le plateau technique MorphOptics du laboratoire Biogéosciences a été acquis en 2014 grâce à un projet intégré incluant des financements du DIPEE de Bourgogne Franche-Comté et des financements de la région. Cet appareil est l’un des scanners d’acquisition 3D dont le service est doté pour des analyses morphométriques (i.e. quantification géométrique des formes) d’organismes dans un cadre de problématiques évolutives.

A l’image des scanners hospitaliers, cet appareil va acquérir une série d’images radiographiques de l’échantillon étudié qui permettront de le convertir en une pile de coupes virtuelles qui renseigneront à la fois sur son anatomie interne de manière fine (résolution de quelques micromètres), et sur la densité des tissus qui le composent. Cette pile d’images peut être compilée en un volume 3D de l’échantillon, permettant ainsi d’accéder, de manière non destructive, à la fois aux structures tridimensionnelles externes et internes de l’échantillon. Après une série de traitement de ces images (étapes de segmentation), un modèle 3D de ces structures est obtenu. Les quantifications morphométriques seront effectuées sur ces modèles 3D obtenus pour l’ensemble des spécimens étudiés.

L’utilisation de ces équipements a donné lieux à des publications dans des revues comme The Anatomical Record (illustré ci-dessous) ou encore à un travail en révision dans American Journal of Physical Anthropology.

Bernardi M, Couette S. Eocene paleoecology of Adapis parisiensis (Primate, Adapidae): from inner ear to lifestyle. Anat. Rec. 300 (2017) 1576-1588.

« We examined the inner ear morphology of Adapis parisiensis in order to make some functional inferences, using μCT techniques to access the internal morphology without damaging the fossil specimens. We analyzed the length and shape of the cochlea, the size of the oval window, and the size and orientation of the semicircular canals of seven Adapis parisiensis crania. Results indicate that the species was more sensitive to high frequencies than low frequencies. Results about the coefficient of agility are in good agreement with previous studies, proposing a slow/medium slow locomotion for the fossil species. »

Modeled ears for the seven specimens. For four specimens (ACQ 211, MaPHQ 339, NHMUK 1345, and UMZC 538), the right ear is shown; for three specimens (Basel QW 1530-1936, Munchen XV-1860-2, and PLV14) the left ear was flipped for easier comparison. (A) Ventral view, (B) Posterior view, and (C) Left side view.

Bernardi M, Couette S, Chateau-Smith C, Montuire S. Middle-ear pneumatization in nonhuman primates: a comparative analysis. Am. J. Phys. Anthropol. (under revision)

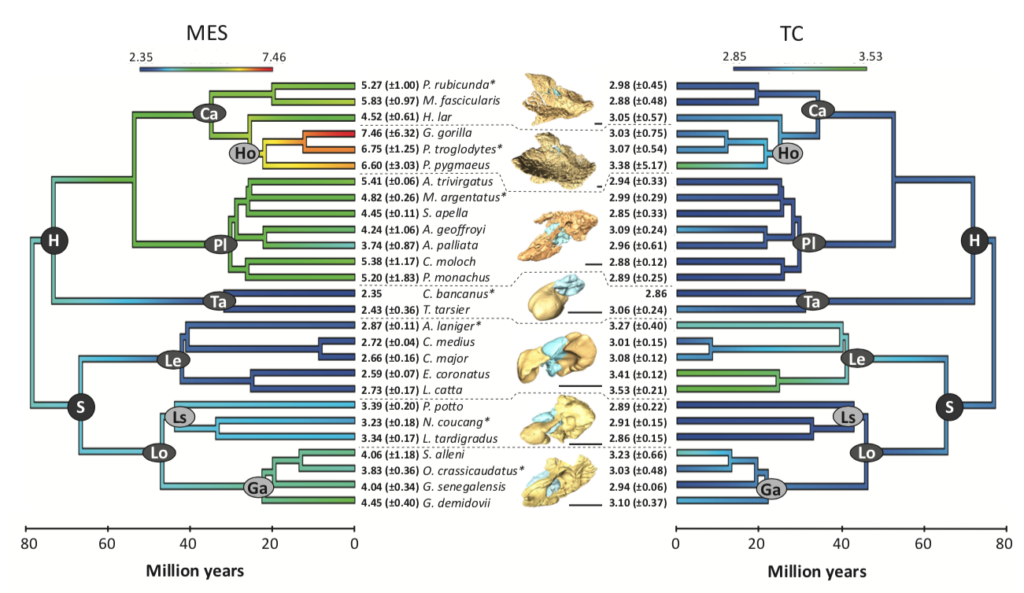
« We test the effects of body mass and phylogeny on middle-ear cavity pneumatization, and the role of pneumatization in hearing function, spanning the anatomical, ecological, and behavioral diversity of nonhuman primates. Our results show that pneumatization in middle ear spaces is under differential selective pressure, indicating several optima for this trait. Pneumatization in middles ear spaces probably modifies hearing sensitivity through pressure regulation mechanisms, auditory bulla size reduction, and frequency modulation. This could explain strepsirrhine adaptation to high-frequency perception, while haplorhine auditory perception is adapted to a broader sound range, including high and low frequencies. »

Scan slice (left) and segmentation (right) of inner and middle ear. Example of a Mico argentatus right ear in an endocranial view.
Time-calibrated phylogenetic tree modified from Springer et al. (2012) presenting the mean values of middle ear spaces and tympanic cavity pneumatization, including confidence interval (95%). For each group, an example of the species indicated by an asterisk is illustrated, with a black line to show the 0.5 cm scale. H: Haplorhini; S: Strepsirrhini; Ca: Catarrhini; Ho: Hominidae; Pl: Platyrrhini; Ta: Tarsiiformes; Le: Lemuriformes; Lo: Lorisiformes; Ls: Lorisidae; Ga: Galagidae.

Navarro N, A. Murat Maga. Does 3D Phenotyping Yield Substantial Insights in the Genetics of the Mouse Mandible Shape? Genes, Genomes, Genetics (2016)

« We describe the application of high-resolution 3D micro-computed tomography, together with 3D landmarks and geometric morphometrics, to validate and further improve previous quantitative genetic studies that reported QTLs responsible for variation in mandible shape of laboratory mice using a new backcross between C57BL/6J and A/J inbred strains.  Despite the increasing availability of 3D imaging techniques, artificial flattening of the mandible by 2D imaging techniques seems at first an acceptable compromise for large-scale phenotyping protocols thanks to abundance of low-cost digital imaging systems such microscopes or digital cameras.  We evaluated the gain of information from considering explicitly this additional third dimension and also from capturing variation on the bone surface where no precise anatomical landmark can be marked.  Multivariate QTL mapping conducted with different landmark configurations (2D versus 3D; manual versus semilandmarks) broadly agreed with the findings of previous studies. Significantly more QTLs (23) were identified and more precisely mapped when the mandible shape was captured with a large set of semilandmarks coupled with manual landmarks.  It appears that finer phenotypic characterization of the mandibular shape with 3D landmarks, along with higher density genotyping, yields better insights into the genetic architecture of the mandibular development.  Most of the main variation is nonetheless preferentially embedded in the natural 2D plane of the hemi-mandible, reinforcing the results of earlier influential investigations. »

Mandibular 3D surface, landmark and semilandmark templates. Light blue and gray dots are manual 3D landmarks. Small green dots represent the semilandmark template. The two gray landmarks and the small purple dot were used as initial reference plane for 2D flattening prior to optimization
Comparison of atlas-based and manual segmentation for the lower molars. Individual represented is the one with the smallest Dice score on most molars. The molar models are colorized according to the sign distance between the meshes segmented by the two techniques. Brown values are positive distances between the atlas-based and manual meshes, meaning that the manual mesh is bigger, i.e. more voxels have been manually segmented as tooth than in the atlas-based approach. Green values are negative distances, more voxels have been atlas-based segmented. Darker the color, greater the differences, and the scale is of four voxels negatively or positively

Navarro N, A. Murat Maga. Genetic mapping of molar size relations identifies inhibitory locus for third molars in mice. Heredity (2018) 121: 1-11

« Molar size in Mammals shows considerable disparity and exhibits variation similar to that predicted by the Inhibitory Cascade model. The importance of such developmental systems in favoring evolutionary trajectories is also underlined by the fact that this model can predict macroevolutionary patterns. Using backcross mice, we mapped QTL for molar sizes controlling for their sequential development. Genetic controls for upper and lower molars appear somewhat similar, and regions containing genes implied in dental defects drive this variation. We mapped three relationship QTLs (rQTL) modifying the control of the mesial molars on the focal third molar. These regions overlap Shh, Sostdc1, and Fst genes, which have pervasive roles in development and should be buffered against new variation. It has theoretically been shown that rQTL produces new variation channeled in the direction of adaptive changes. Our results provide evidence that evolutionary/disease patterns of tooth size variation could result from such a non-random generating process. »